When it comes to information consumption, our society has become numb to spending much time on anything for very long. With the constant barrage of emails, Slack messages, text messages, social posts, instant notifications, and the constant drum beat of news updates, who can blame us? This information overload is shortening our attention spans by the minute. In fact, a study by Jampp found that attention spans decrease by an incredible 88% every year.
Holding the audience’s attention is a critical challenge faced by marketers—especially when content is complex. The answer: Make it interesting, make it visual, and make it simple by turning your content into infographics.
Here are three key steps for creating effective infographics:
- Plan how the information will be presented. Use mood boards to capture inspiring design styles, graphics, colors, and fonts.
- Map out a clear hierarchy and story for information delivery. Break long or complex form content into easily digestible chunks that tell a compelling story.
- Clarify the call to action. What do you want the viewer to take away from the infographic, and what do you want them to do with this information? It could be seeking out more information, making a behavior change, or any number of actions depending on your communications goals.
And because infographics are usually used across a variety of media for multiple audiences, make sure they’re 508 compliant—that is, that they meet accessibility standards for individuals with disabilities.
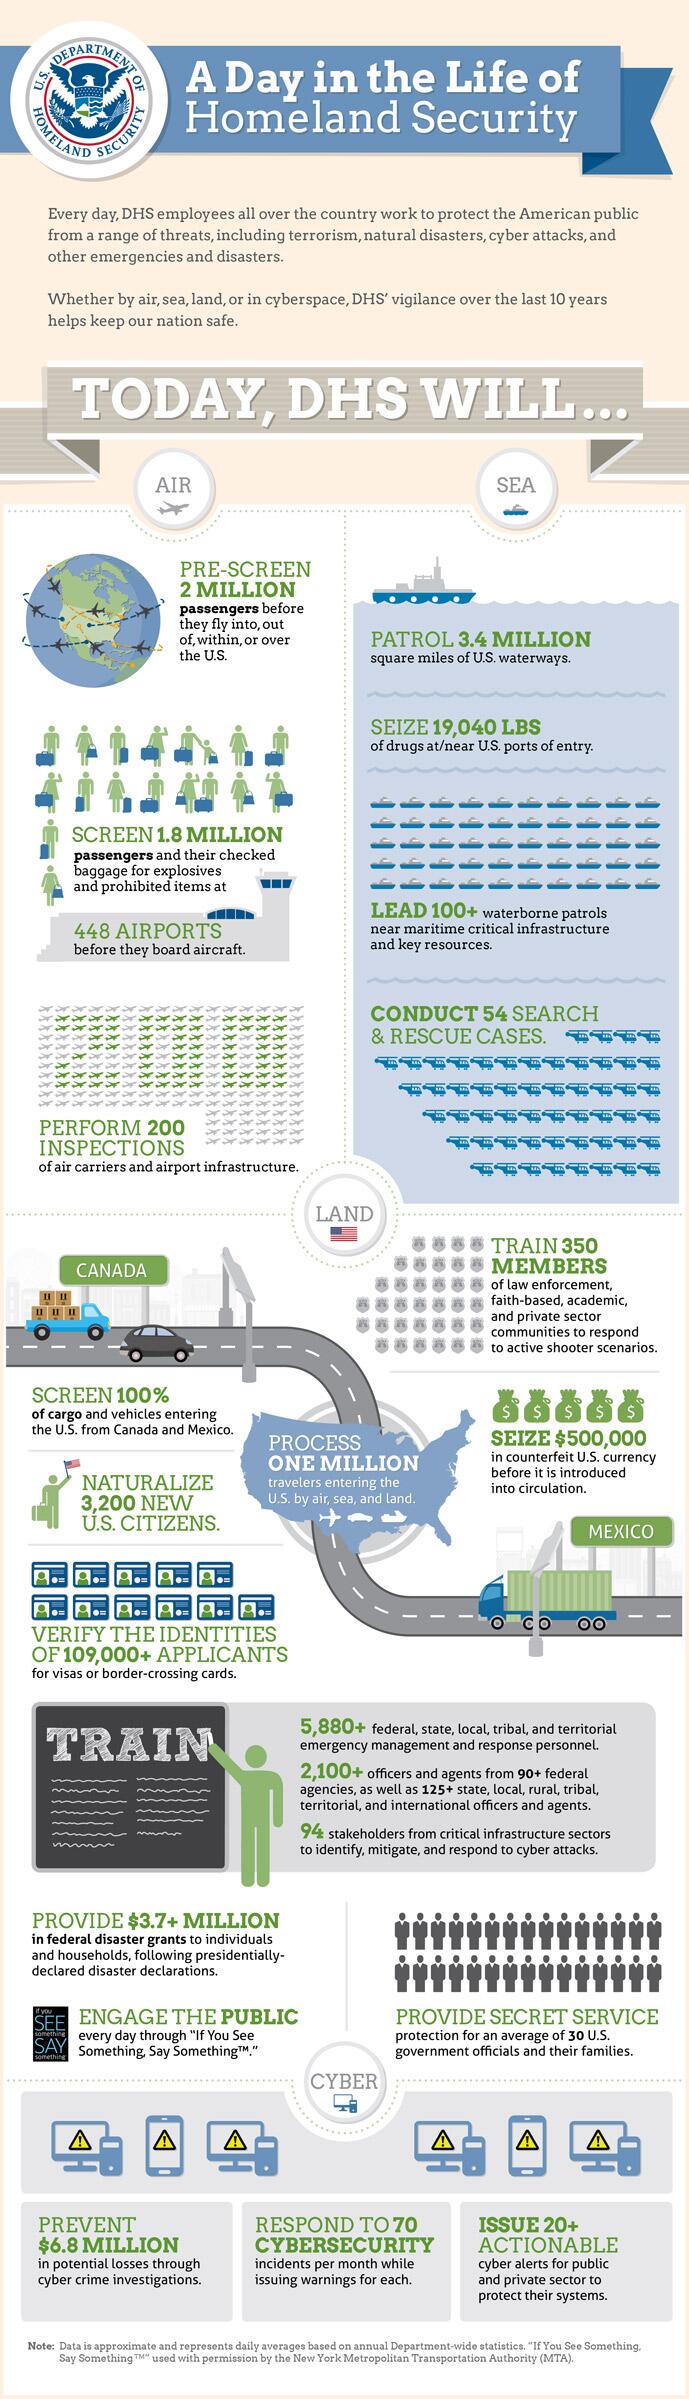
At LMD, we have successfully used infographics to tell long complex stories. Take this DHS “A Day in the Life” infographic, which was based on 12 pages of content:
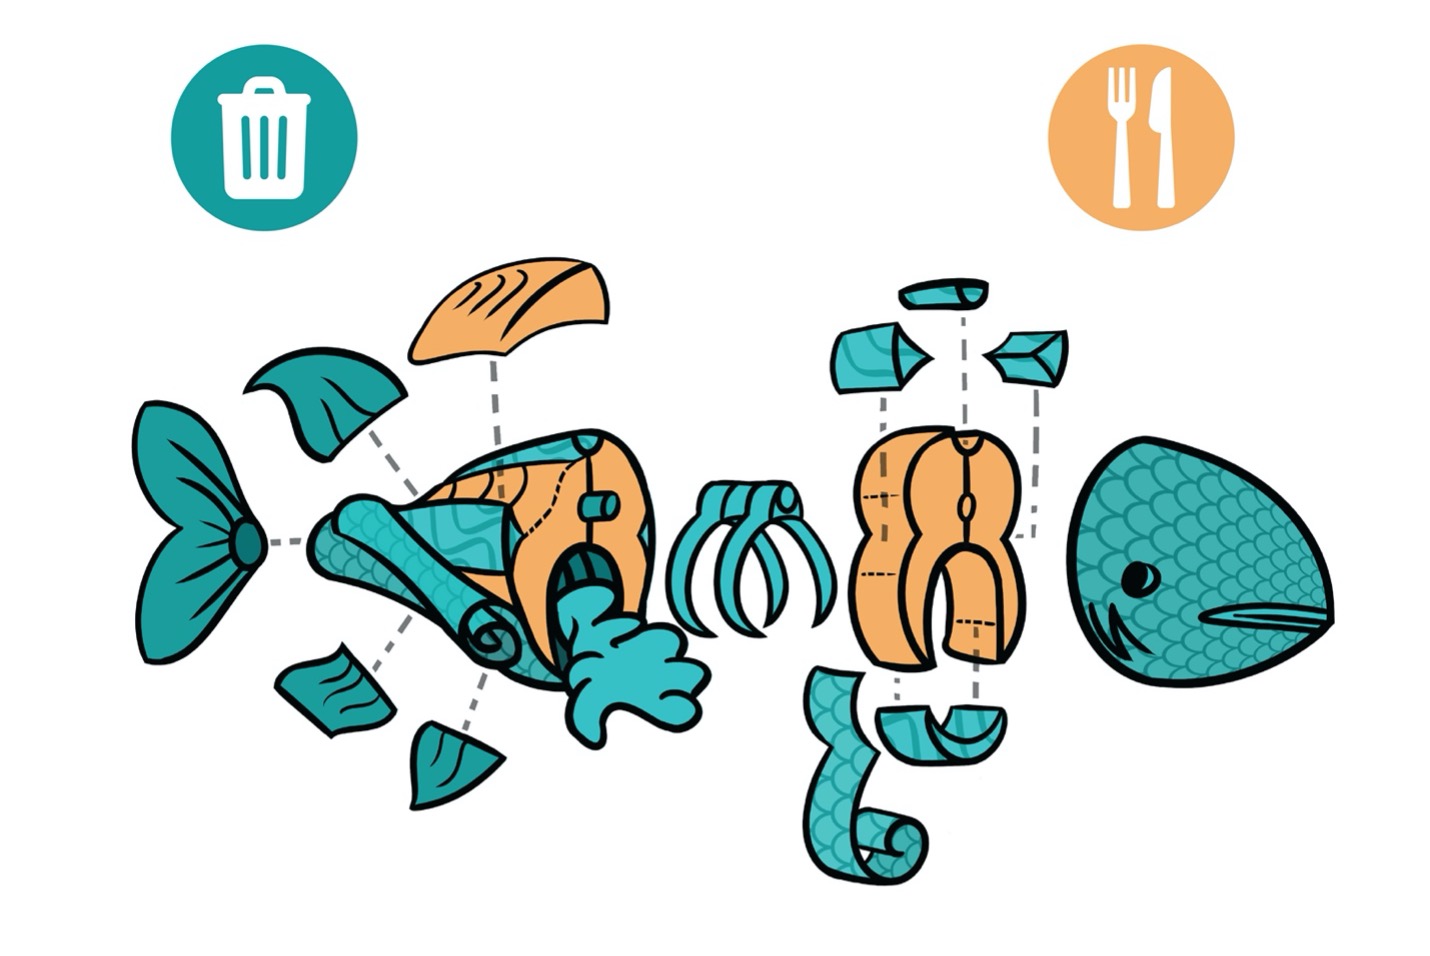
For the EPA, we used an infographic to communicate what should—and shouldn’t—be consumed when eating fish. We used an “explosion” diagram to convey this information in a way that’s understandable regardless of the viewer’s language or culture.
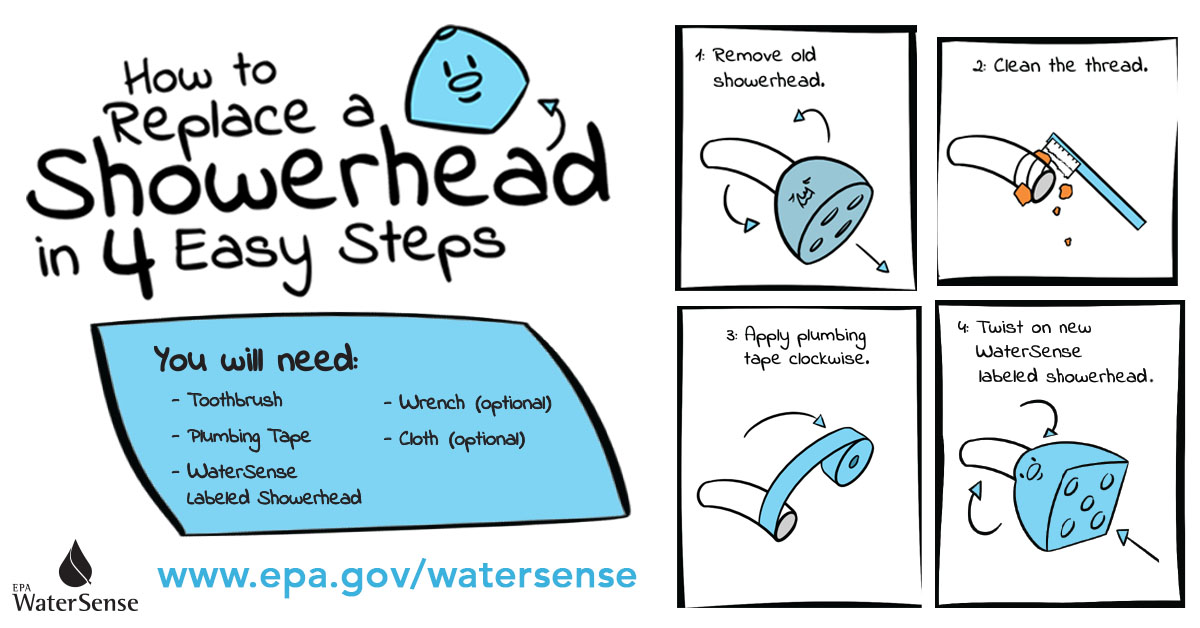
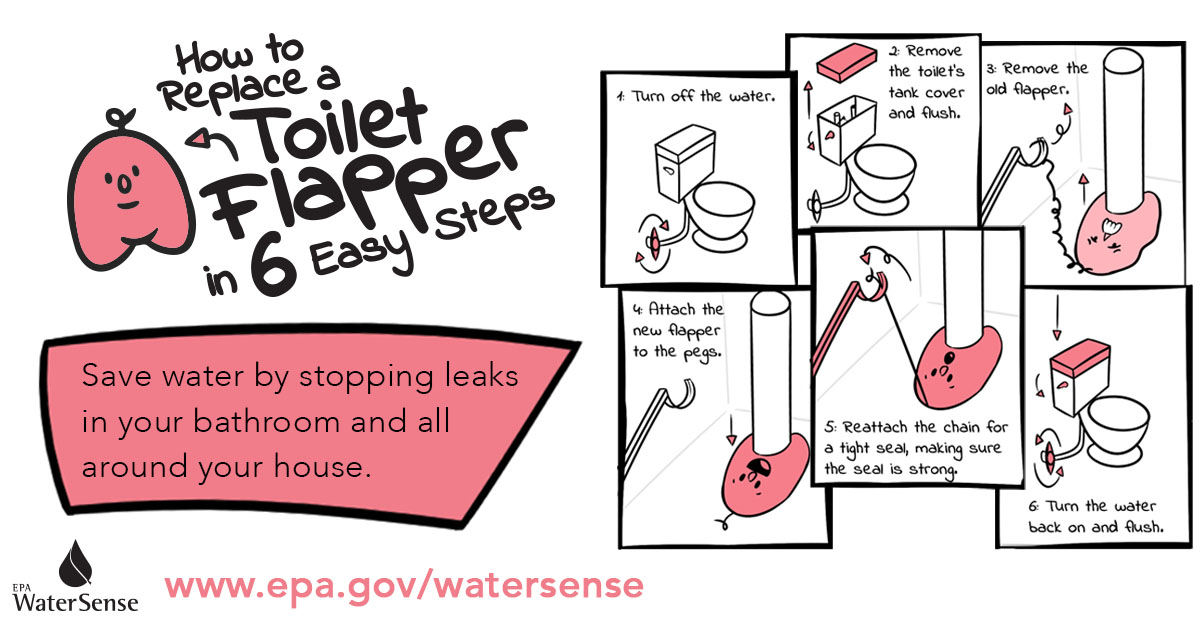
For another EPA project, we brought a bit of levity to our work in how-to graphics that show how to replace toilet flappers and showerheads to save water step-by-step:
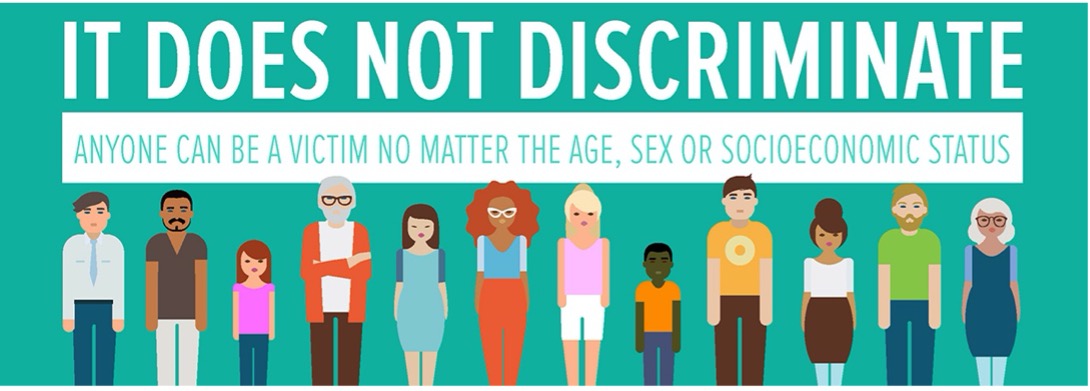
Infographics can also be broken up into smaller pieces for use in social media, or developed into videos—as we did for the U.S. Coast Guard and the U.S. Department of Homeland Security’s Blue Campaign to End Human Trafficking:
USCG Every Day Final from LMD Agency on Vimeo.
What is Human Trafficking? from LMD Agency.
Is your organization interested in using infographics to communicate? Contact us.