
Dear Kristen,
Our company’s CEO has caught the “big data” bug—and is bugging me, the marketing manager, to get insights from Google Analytics about our website and tell him how we should adjust our marketing strategy based on our website traffic.
My confession is that every time I view our analytics, I’m immediately overwhelmed. I don’t know what stats are important, what they mean, or how we should change our marketing strategy to improve our stats. I’m sure there’s a ton of good information there, but I just don’t know where to begin.
I can’t dodge my boss’ questions about our analytics forever. Can you help?
Signed,
Angsting about Analytics
Dear Angsting,
You are not alone! Many organizations never look at their analytics. Why? Because analytics make you feel dumb. You look at all the graphs and numbers with no idea about what any of it means, click some links, stare at some charts, and hope it will all magically become clear.
Analytics are useless unless you know what they mean. Saying “I want to improve our analytics” is like saying “I want to improve my car’s gas gauge.” The gas gauge is just a tool for measuring fuel economy. To get better gas mileage, you need a strategy. The same goes for analytics. It’s a tool that tells you about your web traffic at any given time. It’s the meaning of these statistics that make them so valuable.
As we say in the market research business, some data is better than no data. You can learn a lot about your web traffic—and the impact your marketing efforts are having—with just a few analytics data points. Here are three that should definitely be on your hit list:
1) Audience Overview: This is your one-stop-shop for traffic data and the first piece of data you see when you launch Google Analytics. You can discover all kinds of important information, including how many users come to your site, if they are new or returning, how traffic has changed over time, and much more.
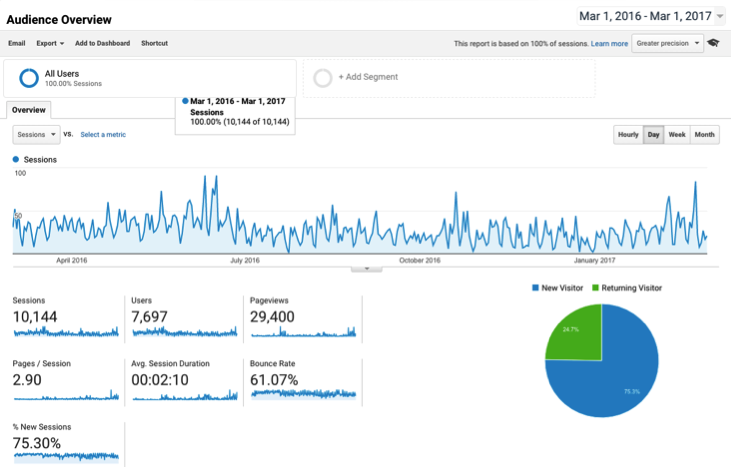
Tip: If you see spikes in your traffic, compare the timing against your marketing calendar. Did you launch a marketing campaign shortly before the spike occurred? If so, it probably did a good job bringing traffic to your site.
2) Engagement Stats: These stats tell you how well your site performs when it comes to keeping visitors engaged. Data points include:
-
Bounce rate: Bounce rate is the percentage of site visitors who leave immediately after viewing only one page. Analytics provides an average bounce rate for your entire site, and bounce rates for each page. A high average bounce rate means that your site isn’t doing a good job of keeping visitors’ interest.
- Session duration: Also known as “dwell time,” session duration means how long do people stay on your site. Logic dictates that the longer a visitor is on the site, the higher the level of engagement.
- Pages/session: A higher page/session ratio is indicative of greater user engagement.
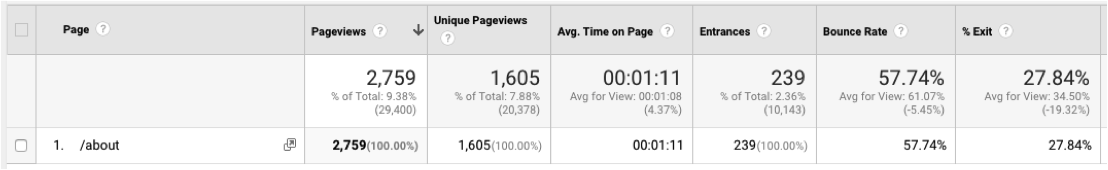
Tip: There’s no industry standard for average bounce rate, but sites with a bounce rate higher than 50% should be looked at carefully to identify strategies that will bring the bounce rate down. Maybe add some video or other interactive features?
3) Acquisition Overview: The data in this section tells you where your traffic is coming from—whether it’s direct (someone typing the exact web address into their browser), from organic search, or from a referring source (such as social media). This data can tell you how well your SEO, advertising, and marketing efforts are performing.
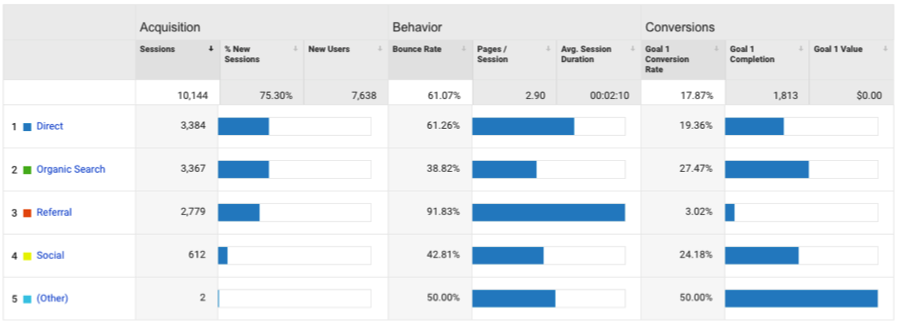
Tip: To see the most popular key words that are being used to find your site, click on "Organic" in the list of channels
BONUS TIP! Set up a custom analytics dashboard. You’ll see a link that says “CUSTOMIZATION” in the top left corner of the page underneath the analytics search bar. You can create a dashboard with only the data points that are most important to you to see how your site is performing at a glance.
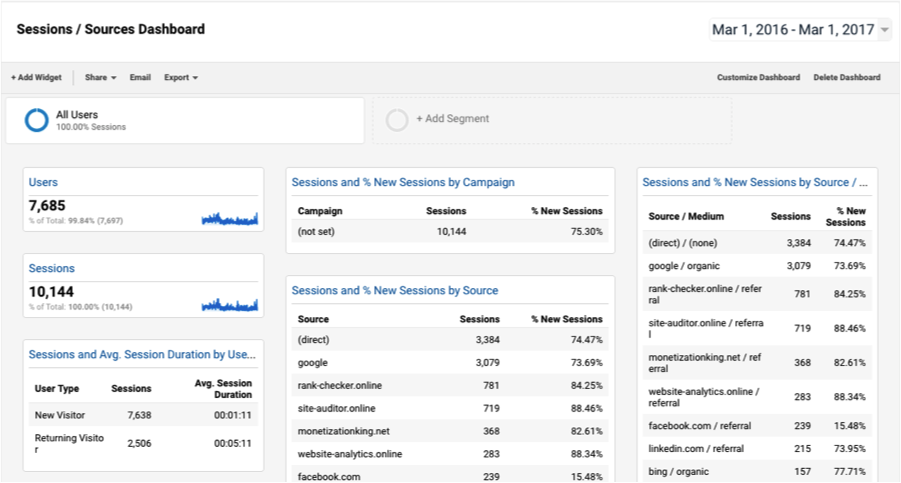
So don't angst over your analytics—start small, looking at just a few data points. As you become more comfortable using analytics, you can take advantage of more data points and the deep insights they provide.
Cheers,
Kristen